Why This Pullback Remains Bullish!
#spy #btc #bitcoin #crypto #dxy #vix
Traders,
Getting nervous yet? Well, I can understand. We are right on some important lines. Let’s take a look at the charts.
First off? SPY:
In my last post, I alluded to SPY. I stated that it remained in breakout territory which is still true today. I stated that I remain bullish as long as we remain above 450. Still true. In fact, all that has happened here is that we have a classic retest of previous resistance taking place currently. If we break below, another story may unfold, and I must re-assess. But as of this post, 450 is holding strong and the retest (if it holds) is yet another rather bullish signal.
Now, let’s look at the Bitcoin ALL chart:
Two posts ago, I showed this bullish triangle. I expected one more drop down inside the triangle and I stated the price support would range between 28,300 and 28,800. We got our drop and we got our support. I remained bullish.
One post ago, I anticipated a breakout to the upside due to patterns remaining bullish. We got our breakout to the upside.
But now where are we at? Well, IMO, and according to the charts, we are still positioned biased to the upside. Due to the credit rating downgrade in the U.S., markets are pulling back. Our only question is whether they will now turn bearish. Or, will they remain irrational and bullish? My bet is on the latter but we shall soon find out.
Bitcoin is pulling back with the markets to test the topside of previous resistance as support. If it holds, we'll continue up. If support fails and we drop below 28,500 ish, I will have to reassess the chart.
For now, this classic retest remains yet another bullish signal.
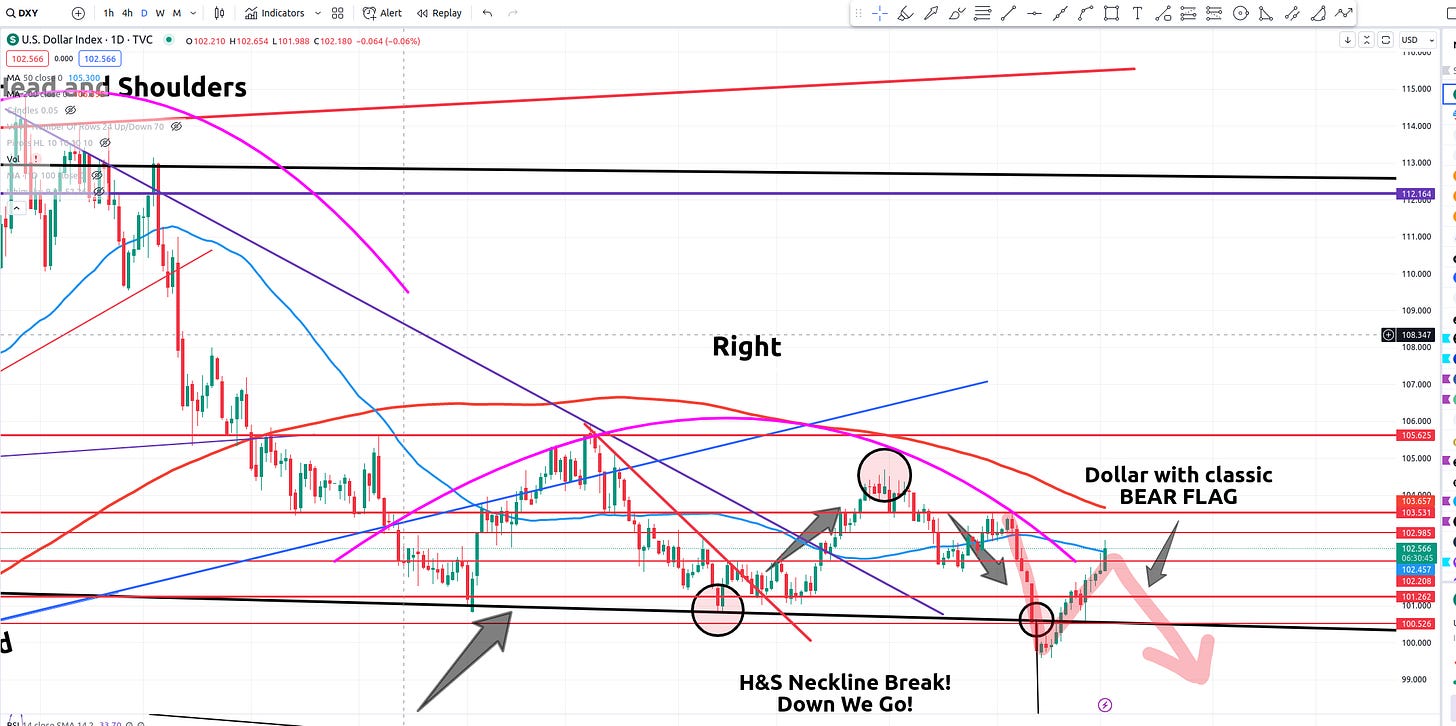
Next, let’s take a look at the dollar:
The dollar continues its journey down. So, is my H&S pattern still intact? Well, on the weekly it is. Does that count? I think so.
It's not like the dollar has turned the corner here and growing stronger. We are still very much in a downtrend. Even that right shoulder is still valid. And, like I said, on a weekly chart that neckline still holds. Once broken, the dollar is in trouble.
What would invalidate my H&S pattern? Well, if the dollar beats that 50-day moving average and then proceeds to move up and above that 103.53 level with confirmation, I might be wrong and would have to re-evaluate at that point. Until this time, the DXY has formed a classic bear flag and I expect weakness to continue. The weaker the dollar, the more dollars it takes to buy a thing. The more dollars it takes to buy a thing, the higher the prices will go to reflect what is needed. This includes stocks.
Finally, a look at our greed fear index:
A quick look at our VIX chart shows us that we are range-bound since June. Exactly, as I expected and have stated numerous times in past posts. But now, with the U.S. credit rating downgrade, fear has spiked. Will we break this range and move up? We could, yes. But to do so, we need the VIX to move above that 15.94 level with confirmation. As of today, the VIX can still be technically classified as range-bound at all time 2-year lows. Of course, when the VIX remains low, the market will remain relatively positive. This is bullish.
In conclusion, of our four leading charts that I track most often, all (though dubiously place on important lines) remain bullish until price action confirms otherwise. Thus far, it hasn’t and we remain bullishly biased both in the U.S. stock markets and in crypto (specifically Bitcoin).
Stay tuned and I will try my best to keep you all up to date on this unfolding scenario.
Best,
Stew
⛓️ 🔗 Important Links 🔗 ⛓️


