
My Pivot Zones Indicator
Traders,
My “Pivot Zones” indicator is truly something special! Many of you who have been following me from the beginning have witnessed the success of the indicator in action as I have publicly posted all trades that I have entered. In just over a year since discovering, coding, and introducing the indicator, I was able to increase my stock portfolio by almost 50%, a remarkable success by almost any account. All of my past trades are available for public scrutiny by clicking the “stock tracker” button below.
As my followers know and have witnessed, my indicator works best on assets with high market cap and a high amount of trading volume. This is where it really shines!
But the intent of this page is not to sell you on the indicator. I am not a salesman. Instead, I allow the indicator to speak for itself by continuously posting my trades. Again, you can view my trade history by clicking the “stock tracker” button above and/or by viewing the site’s “Trade Alerts” tab above and browsing through the archives.
In short, the indicator works by providing you with a graphical display of what are called “Pivot Zones”. These are areas in price where it appears that the market has pivoted from accumulation to distribution or visa-versa. When the market also becomes overbought or oversold, my indicator will also display a “Sell” or “Buy” signal. By combining these Sell/Buy signals in confluence with the Pivot Zones (green or red colored block), it increases the probability of understanding future price action dramatically.
🔶 EXAMPLE
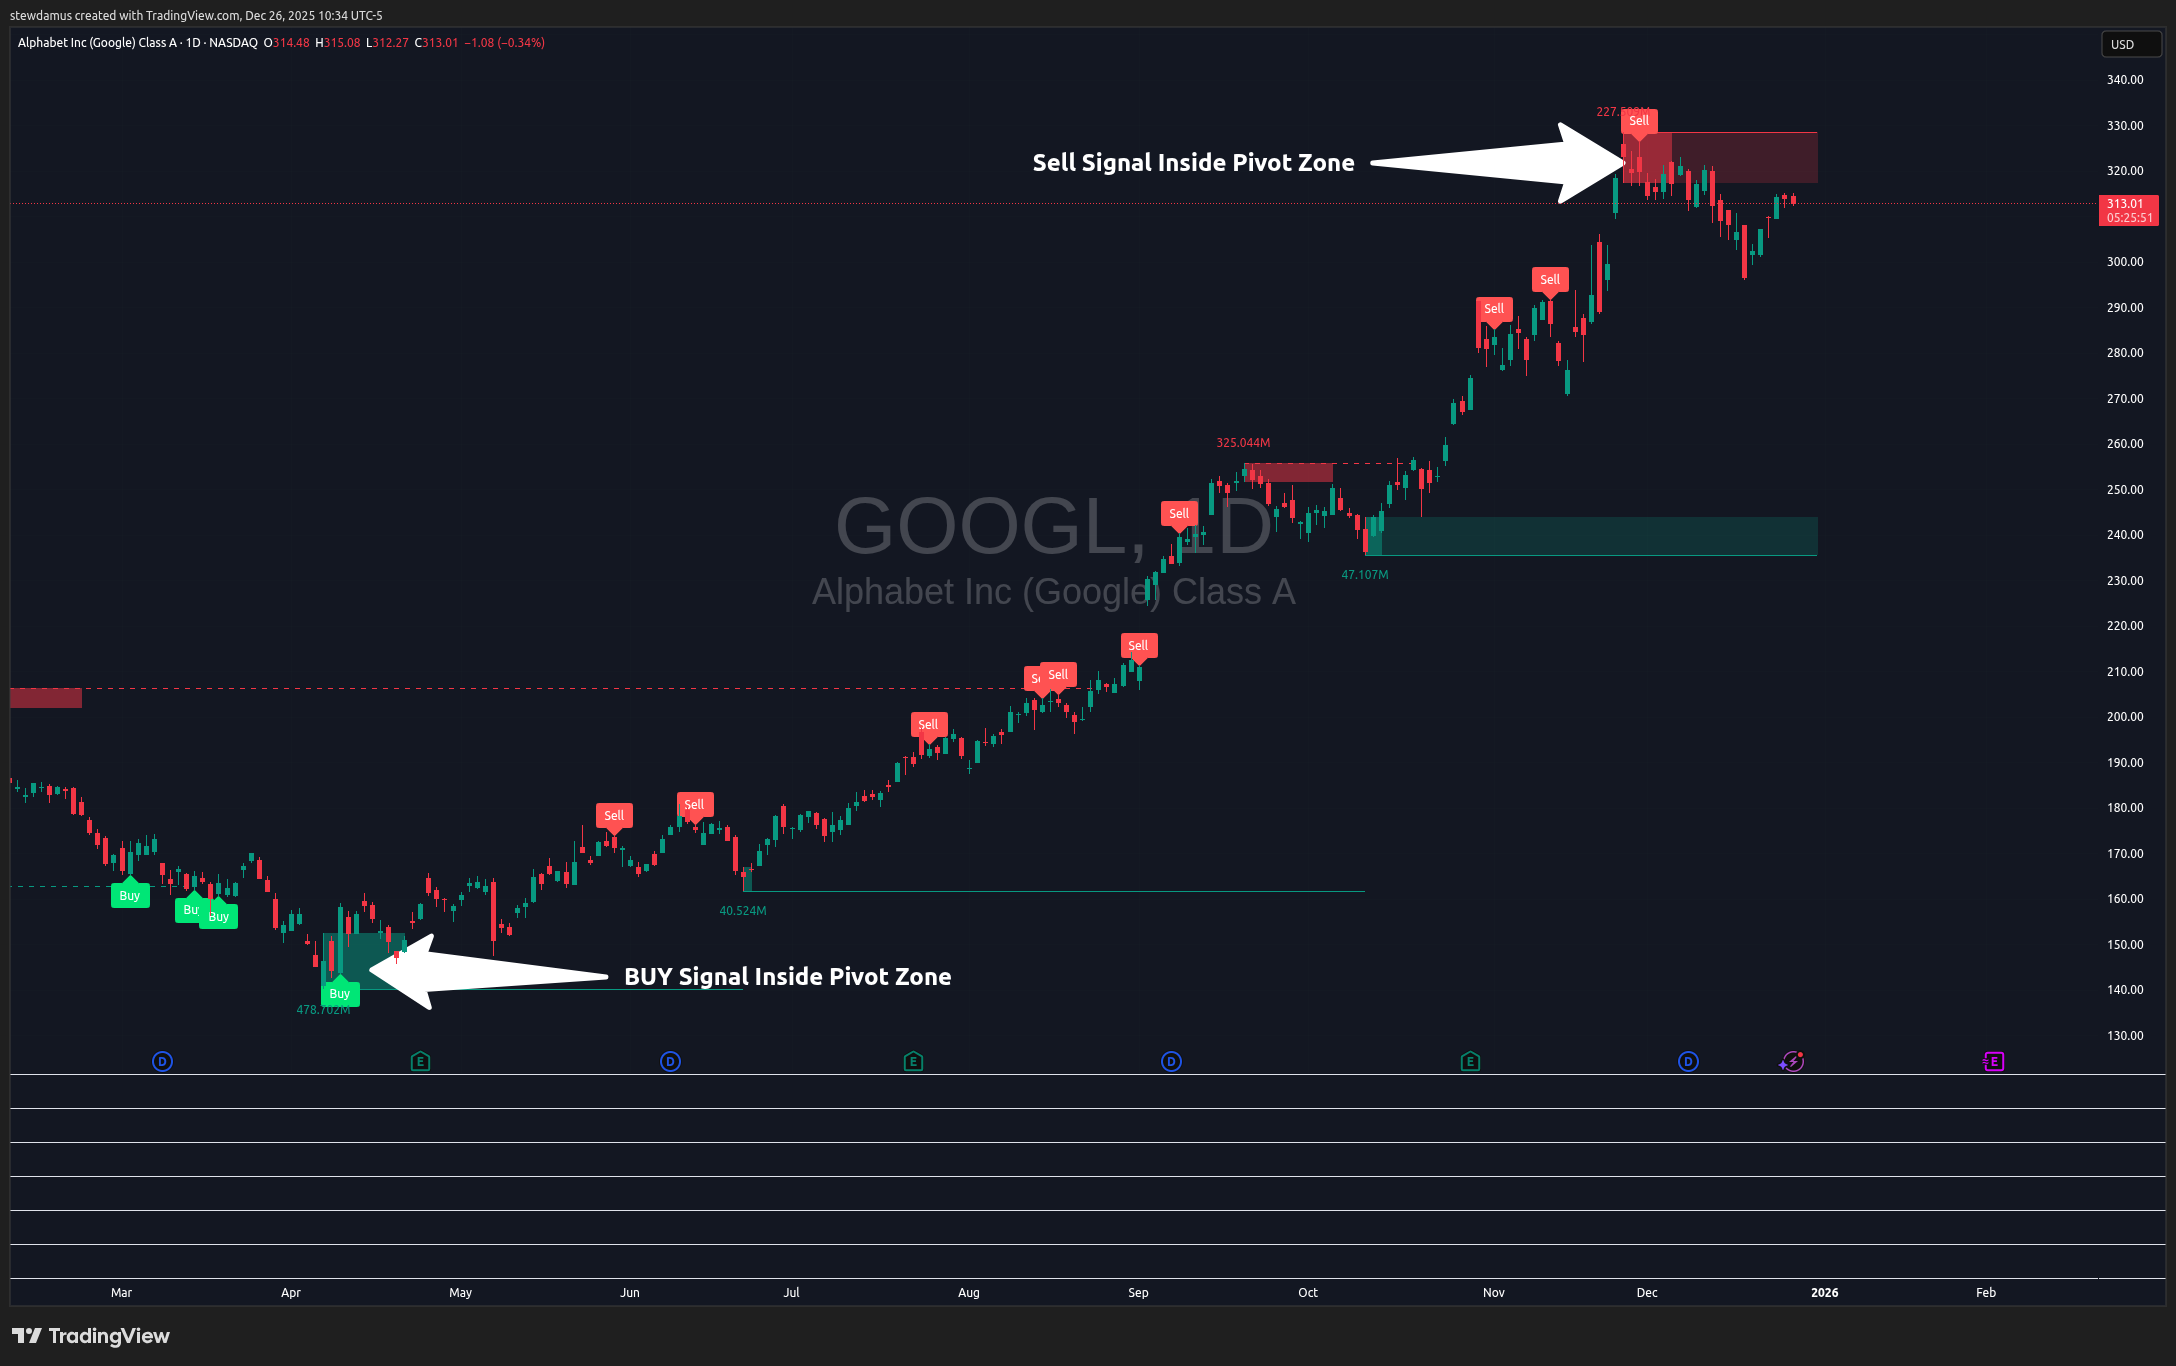
In the chart above, you will see quite a few "Buy" and "Sell" indicators given by the indicator. You will also see a few pivot zones indicated by the green or red blocks. But it is not until a "Buy" signal is given inside of a green pivot zone or a "Sell" signal is given inside of a red pivot zone that it becomes critical to pay closer attention. The confluence of indicators gives highly probable signals regarding price action moving forward, as clearly demonstrated on the example chart provided above.
So here, you would have bought GOOGL when the “Buy” signal was given in the green pivot zone at a price of 143-159, and you might have sold when a “Sell” signal was given in the red pivot zone at a price of 316-326 for over 100 percent profit!
Backtesting the indicator on multiple high-cap/high-volume traded assets has yielded a 90 percent-plus success rate in achieving profits.
The indicator works in higher time-frames as well as lower, though I mostly only use it on the daily.
If you are interested in purchasing the indicator, hit the “Subscribe now” button below and choose the “Buy My Indicator” subscription option. The only prerequisite at this time is that you must be a TradingView member to use the indicator. If you are not a TradingView member, please sign up here before purchasing my indicator.