
Confirming Chart Patterns With Volume
#wyckoff #bitcoin #volumetrading #patternconfirmation #wyckoffpattern

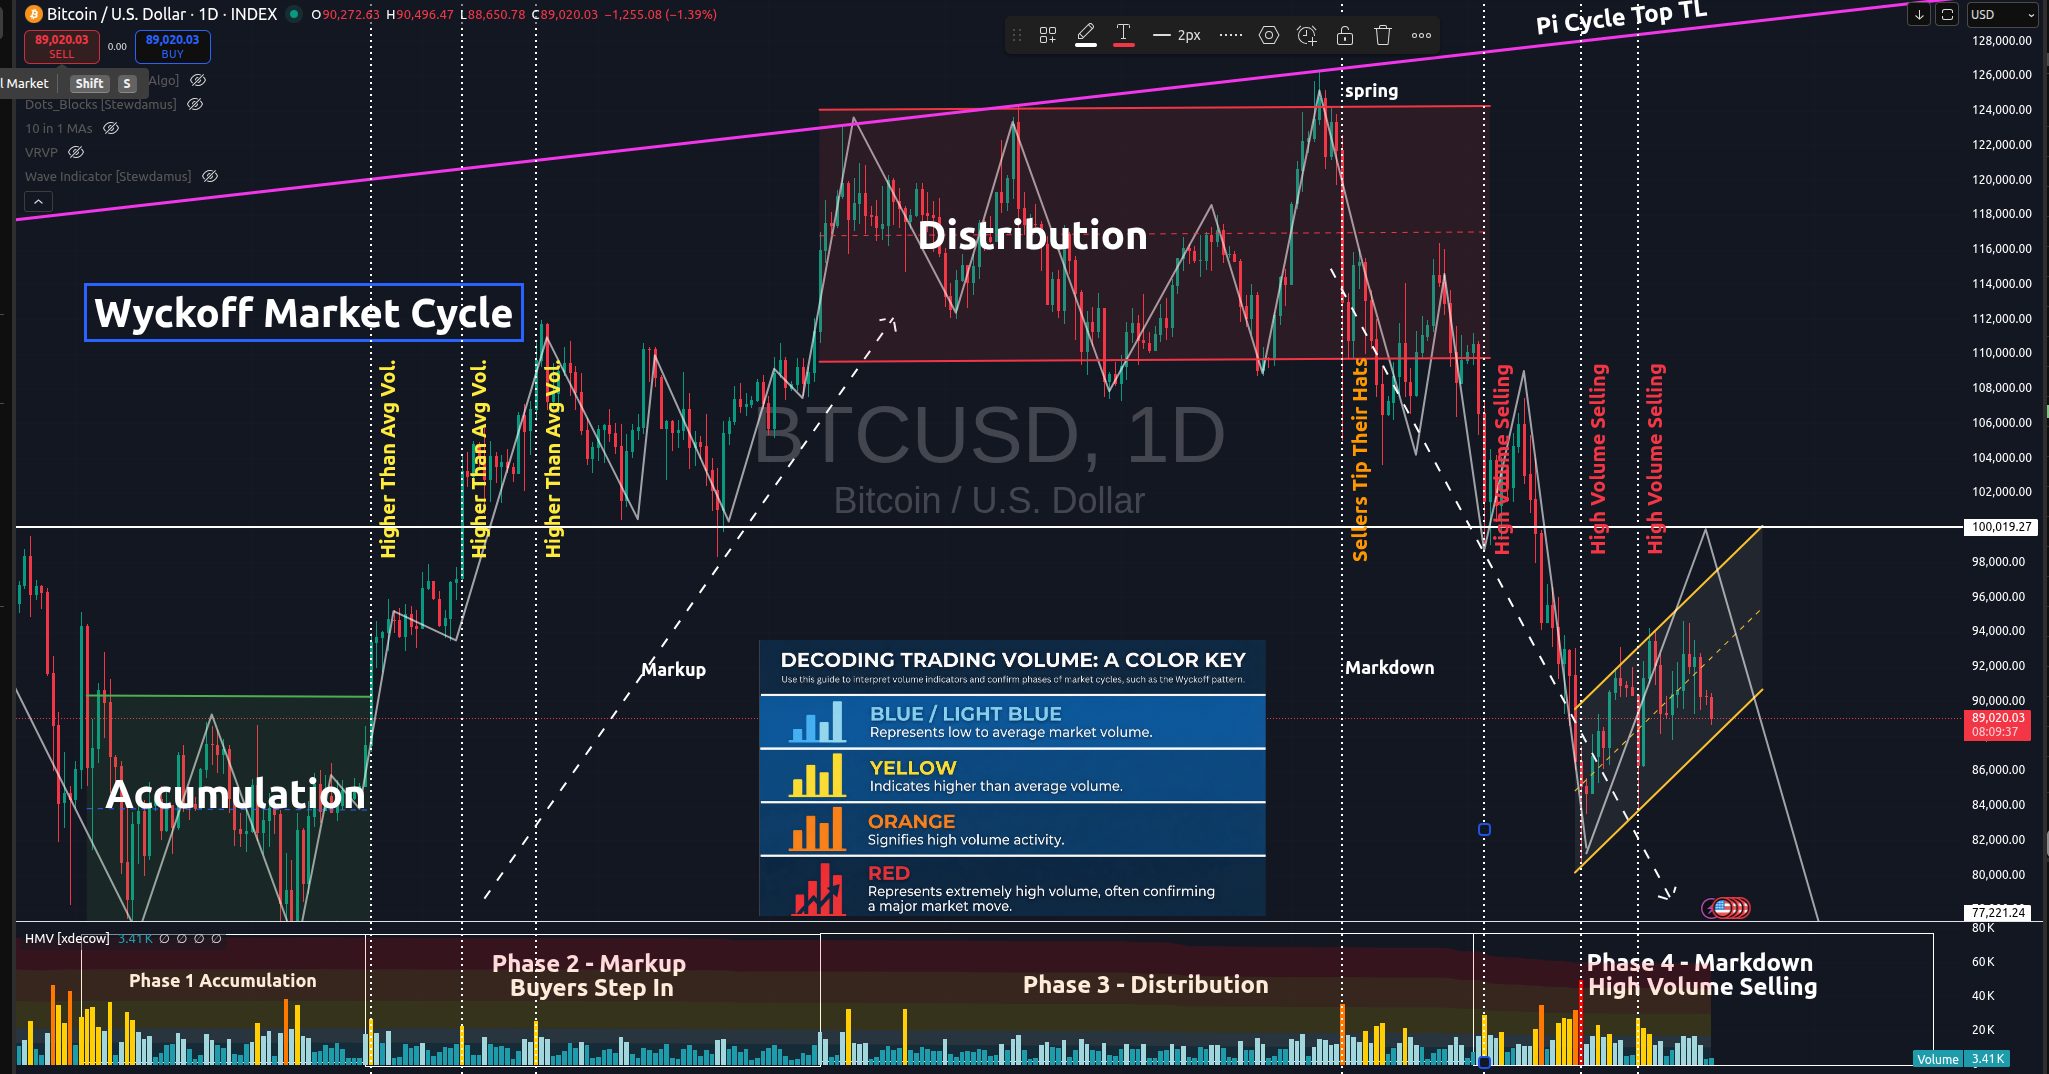
In the chart above, one can clearly recognize the Wyckoff Market Cycle pattern. The pattern's legitimacy can be confirmed by volume. The volume is represented in the lower portion of the chart.
Low to average volume candles are blue. Average volume is indicated by light blue candles. Yellow candles represent higher than average volume. Orange is high volume. And red represents extremely high volume.
You will see each phase of the Wyckoff Market Cycle pattern confirmed by this volume on our current Bitcoin chart.
First, the market enters the accumulation phase. Market volume is fairly high, as seen in the accumulation quadrant in the lower left on the chart. However, it is important to note that there is an equal distribution of high-volume selling days as there are high-volume buying days. Thus, price tends to trend sideways within the channel until the true buying power comes into action.
Next, the buyers step in and take the price higher. This is generally indicated by a high-volume day when the price breaks above the accumulation channel. When buyers step in, most of the yellow and orange volume candles are, in fact, buyers in the markup phase. You can verify this is true by lining these higher-than-average volume candles up with the green price candles on the Bitcoin chart. This indicates the markup phase has begun and is underway.
Then, we come to the distribution phase on our chart. Notice the volume in that 3rd quadrant, the distribution quadrant. It is mostly average volume. Institutional sellers are attempting to carefully exit quietly. But you can also see that near the end of the distribution phase, sellers are starting to step in, tipping their hats and indicating that the distribution phase is about to end.
Finally, sellers take back full control, dropping us from the distribution channel altogether. High volume selling confirms this move and the pattern. The final quadrant in the bottom right proves that mostly sellers have control, as the majority of higher volume candles (yellow, orange, and red) are credited to the sellers.
Our Wyckoff Market Cycle pattern is now confirmed, and further selling can be expected until volume is once again taken back by the buyers. One will need to see clearly that high-volume candles are in line with green price candles. In this chart, that is not yet the case. Thus, more selling should be expected until it is clearly evident that buyer command control once again.
Hope you found this brief educational write-up informative and helpful, as volume can often be utilized in many uncertain pattern formations to find pattern legitimacy and confirmation.
✌️Stew