Bitcoin Future Price Scenarios
Is it time? #bitcoin #btcusd #crypto #cryptocurrency #btc
Traders,
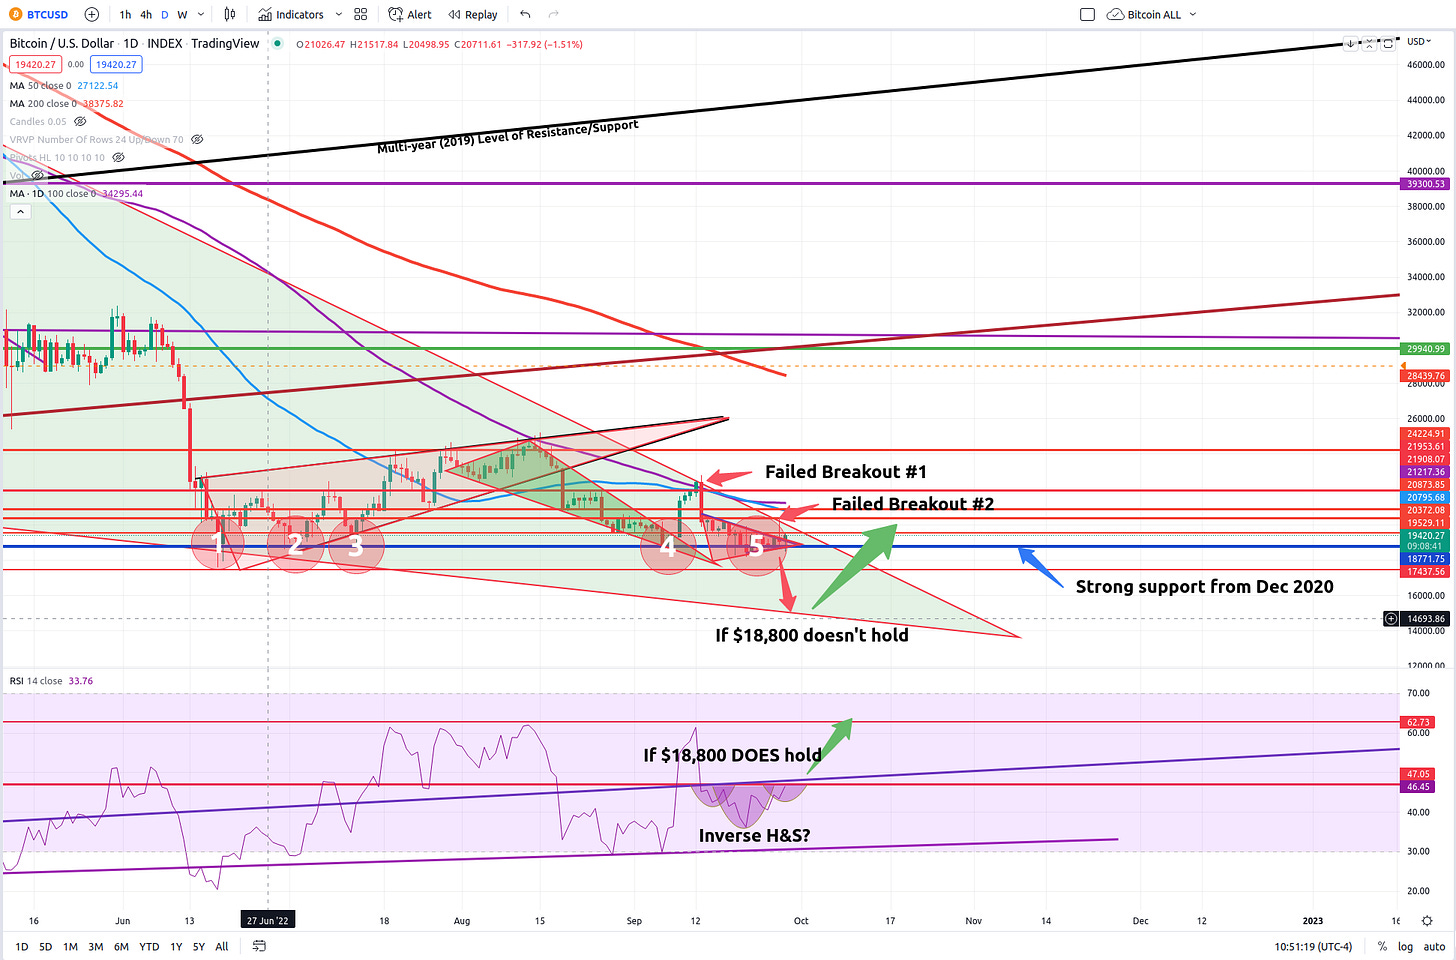
After two failed breakouts of our long-standing bullish descending wedged (since Nov. 21), BTC is back down to our super strong support of $18,800. This support has held us up on 5 separate occasions since our June low. It has not broken down below with confirmation on the daily since Dec. 2020. Confirmation equals two daily candle closes below.
However, if Bitcoin has taught us anything, it's that we should expect the unexpected. I have two potential price movements in my radar pending this all important support level.
#1 = 18.8k Support Fails
You can see that after failing to break out of our wedge the second time, BTC has retreated back into the red triangle. I have colored the triangle red due to it's inclination towards the bearish side. However, our 18.8k support has caught the price once again and is giving ole' BTC another rest.
Should BTC break to the downside, I would expect it to test the bottom of our triangle one more time (currently 15k). Now, 15k does not have to be a precise price. We could wick down as low as 14k before the selling resides. But I would expect the body to close at or around 15-16k on the daily when it's all said and done at which point we rebound and finally break out to the upside of our long-standing descending wedge.
We don't have much longer to live inside of this wedge. The tip of the wedge extends into mid-Nov and that is it! But I expect decision time to come sooner. I don't think we'll make it to November before the market is forced to decide.
If we break to the upside, which is probable given the nature and character of descending wedges, this is very bullish for BTC.
But, if in the unlikely scenario we break to the downside, the typical capitulation period for these long-standing wedges is fairly short in comparison. I would not estimate it to last more than a few weeks to a month at most. And then we go up.
Essentially, this long-standing wedge is telling us all that the bottom is near ...for Bitcoin, at least. I cannot reiterate the same sentiment for the broader markets which I am also tracking though, I do anticipate some sort of blow off top for them. If you have been following my weekly video updates, you're already familiar with my theory here.
#2 = 18.8k Support Holds
So, let's say our support holds once again, the fifth time. What do I anticipate here.
Well, obviously, the support holding is great news. But to anticipate price movement here, let's take a look at our RSI. You can see that I have charted what could potentially end up being a bullish inverse Head and Shoulders pattern. The neckline would be the red horizontal resistance which we are currently up against as I type. If we break above this, then I expect the market to bring enough volume and buying pressure in to finally and at last break to the upside of our descending wedge. It would be at this point I would proclaim that our bottom was in at the June low of around 17.5k.
Have these things charted and you'll be in a much better position to trade successfully in the next few months.
Best to you all traders!
Stew
[/list]
https://www.tradingview.com/x/JoP8O6wK/


