
Altcoin Markets Are Looking Ready To Go
And some trade updates/strategy... #altcoins #altseason

Traders,
I was debating on whether or not to do a weekend video update but decided not to because most of the indexes and tickers that we track for lead market direction have not changed and remain on track. This makes it easy for me as I can just sit back and confirm, “Yep, what I said would happen is happening”. At the same time, it makes it hard for traders who are running low on patience.
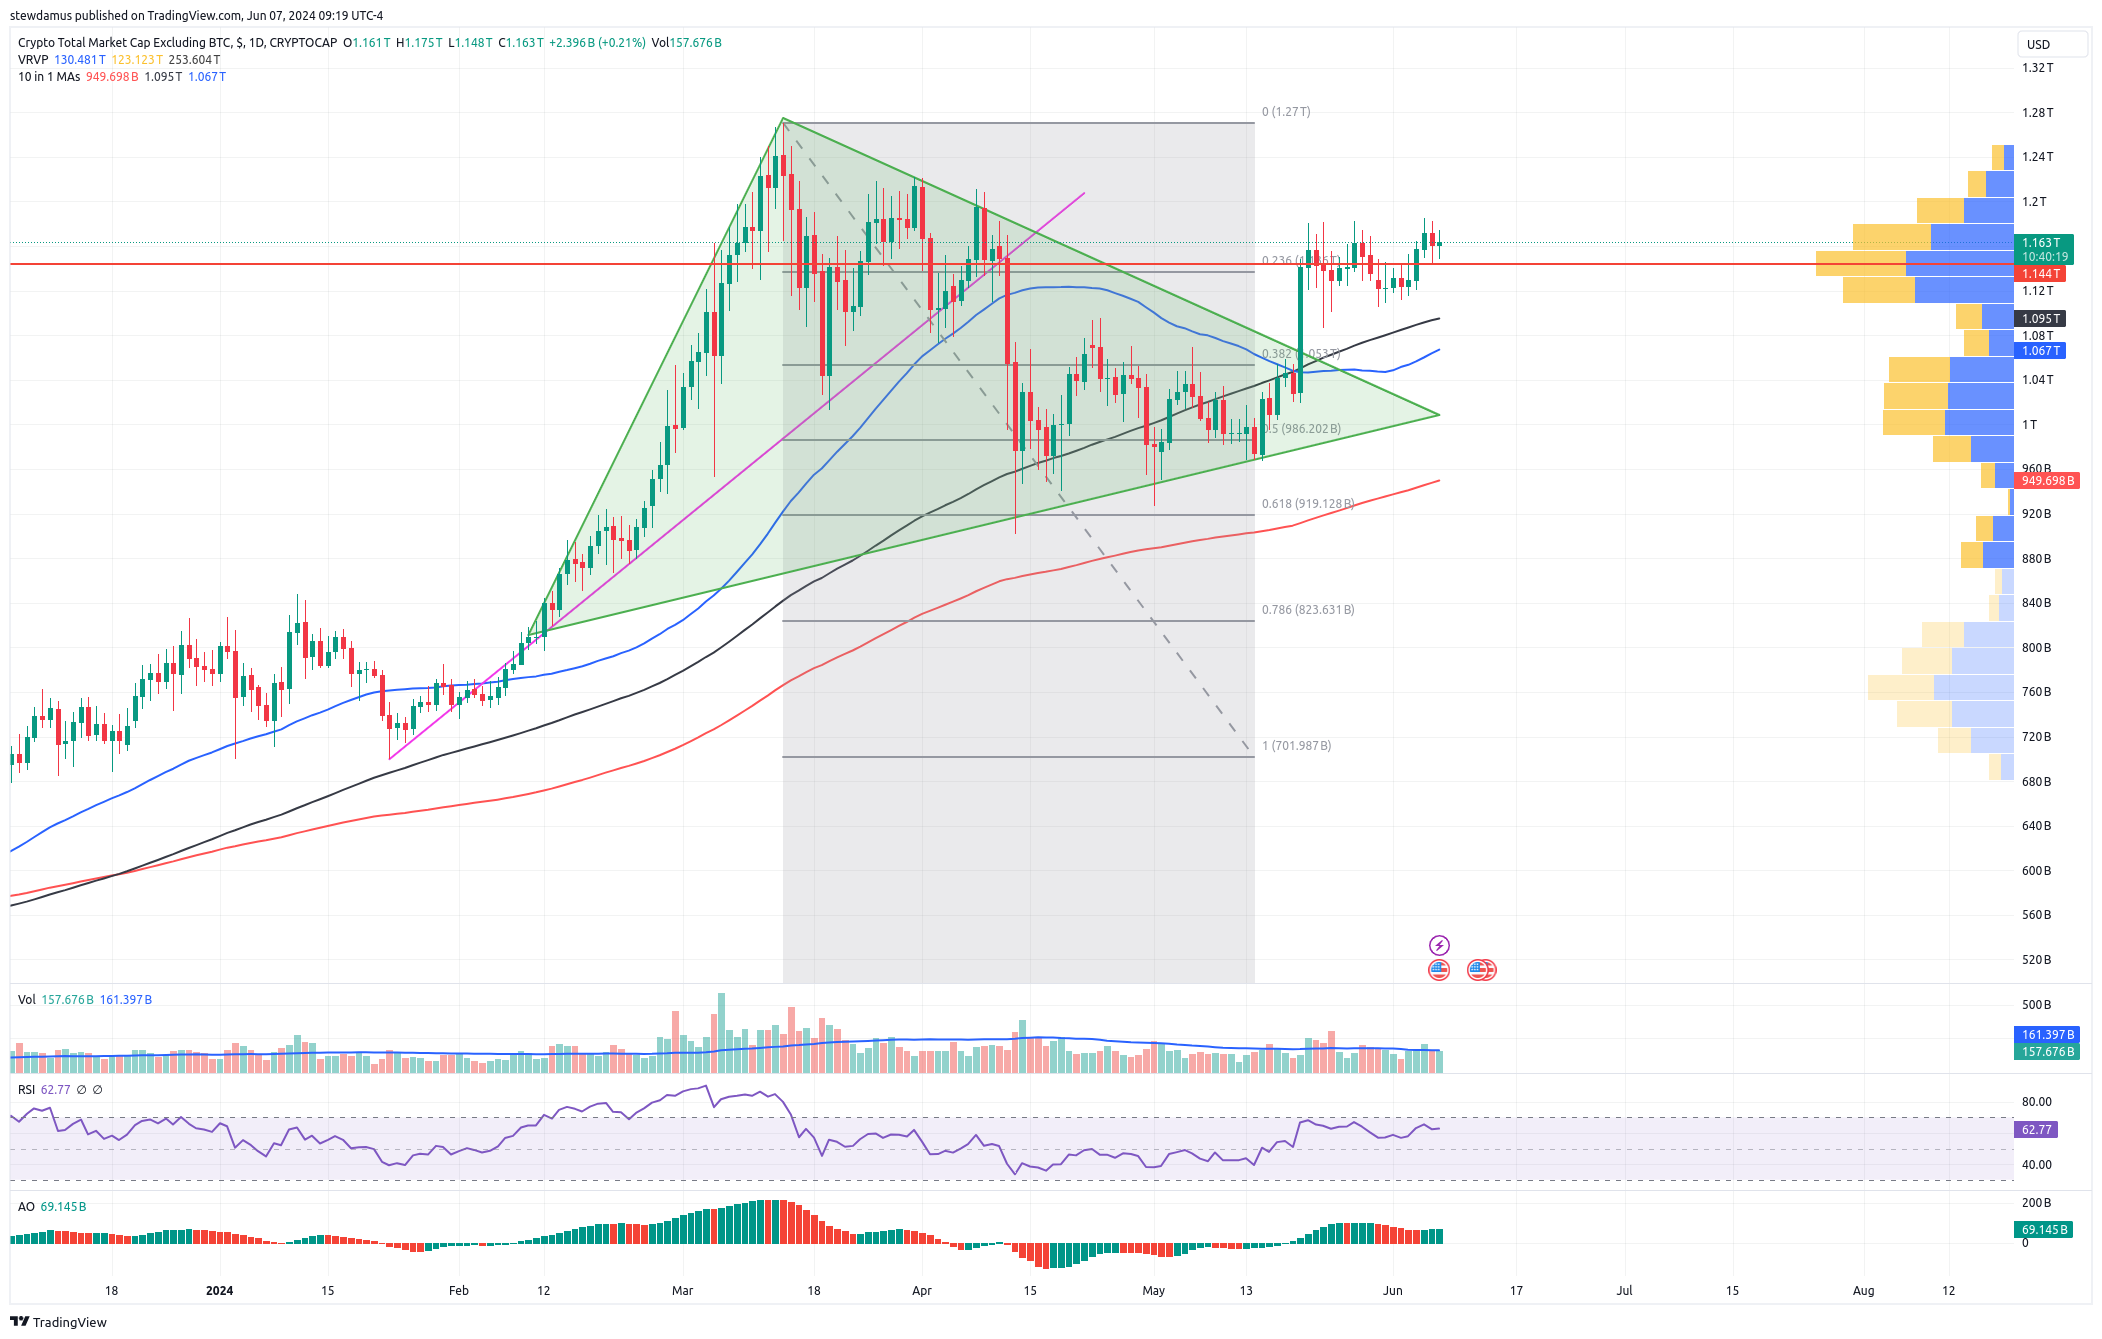
I do feel we are nearing the end of this period of accumulation. A quick look at our TOTAL charts confirms. The TOTAL2 chart shows we have exited from a bullish triangle and are ready to make fresh highs soon. We’ve got good support with that PoC from our VRVP which incidentally coincides with a psychological fib retracement level of .236. All SMAs remain on the underside of price acting as support. Additionally, the RSI is not too hot for a good pump in the next few weeks.
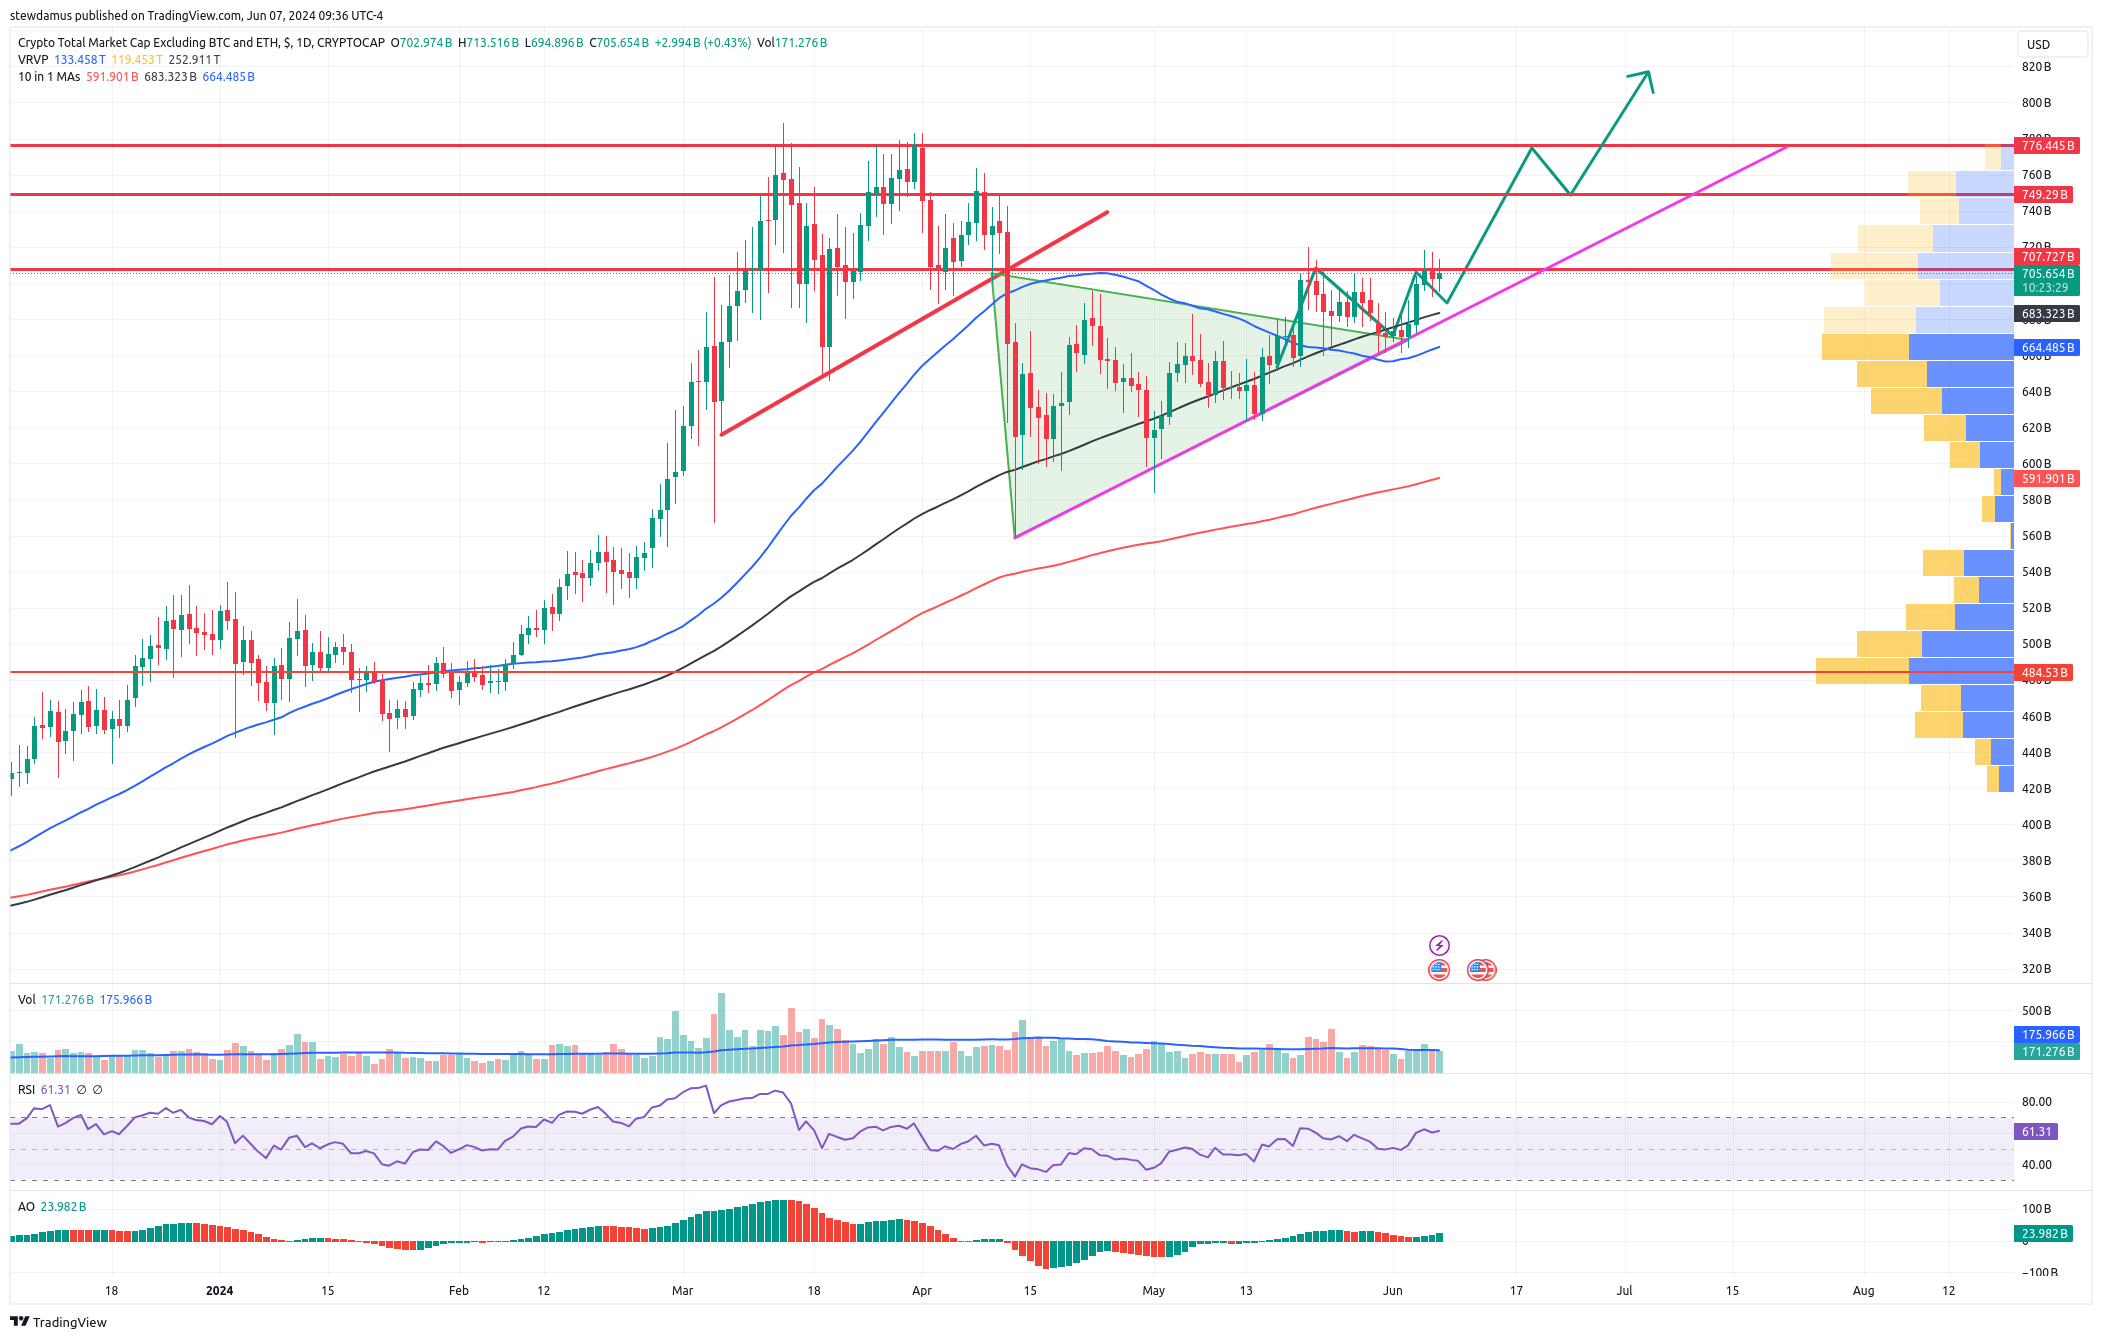
Our TOTAL3 chart(below) shows a similar sentiment. It is maybe not quite as bullish as our TOTAL2 chart(above) which includes Ethereum, but it is still bullish just the same. You can see that after we dropped below support we formed a new support(pink TL). This has held us and we have currently been fighting previous support which is now acting as resistance. Once that breaks, off we go. I have the projected price action in place with levels.
Now, as far as trade updates go, I have one important trade update and a corresponding chart to go along.
