

Trading Fam,
Thought I'd pop out a quick post to let you know what I am seeing on the GOLD chart.
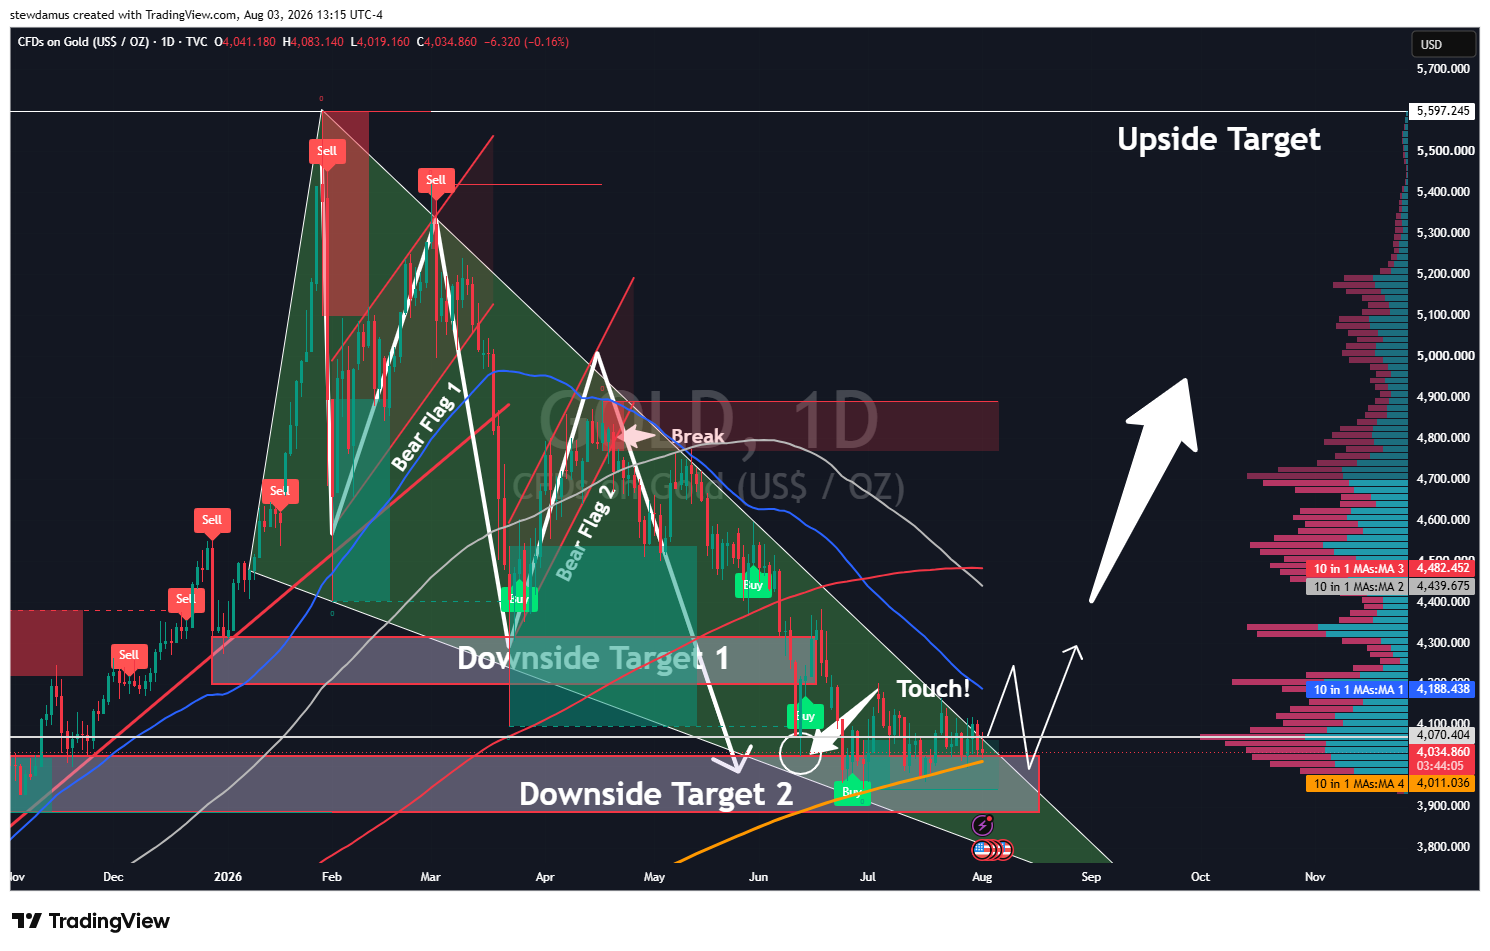
GOLD has consolidated nicely inside a bullish descending triangle since the beginning of this year. Consolidation was expected, though the timeframe has extended beyond what I anticipated.
Price has moved all the way down to touch our 350-day SMA inside both my "Downside Target 2" area, as well as a large buy-side liquidity block. This buy-side pressure could force GOLD's price up through the top of our triangle. Of course, though the initial price surge could flow for a few days/weeks, it does not mean the price will only continue up from the break. Typically, price does like to come back to important resistance and retest. Therefore, if GOLD does break the triangle, it is well within reason to expect the price to come back and retest the top of that triangle or the 350-day SMA again at some point in the future before continuing upward again.
Also, though less likely, it is also possible that GOLD could break the 350-day SMA to the downside and test the bottom of our triangle one more time before moving up.
The highest probability at this point remains upwards to sideways price action for the next few weeks/months.
✌️Stew